What your creatinine and eGFR mean
Creatinine and eGFR are the two numbers that tell you how your kidneys are filtering. They're linked — eGFR is calculated from creatinine — and they're easy to misread, because everyday things can nudge creatinine up. Here's what they measure, the ranges, the eGFR stages, and why the trend beats any single reading.
Quick reference: for the typical range at a glance, see creatinine & eGFR in our blood test results library.
This is general educational information, not medical advice. Kidney results should be interpreted by a clinician in the context of your history and other tests.
What they measure
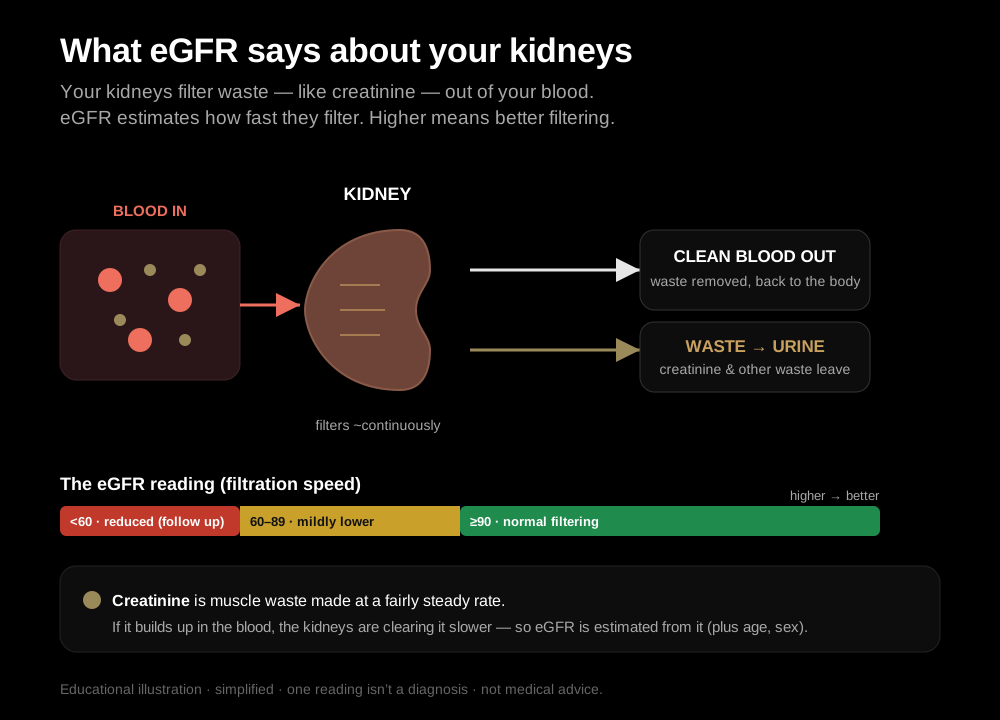
Creatinine (often shown as Cr or Creat on a lab report) is a waste product your muscles produce at a fairly steady rate as they use energy. Healthy kidneys filter it out of the blood and pass it into urine, so the amount left in your bloodstream is a window into how well they're filtering. Because your muscles generate it at a roughly constant pace, a rising blood level usually means less is being cleared — not that more is being made.
eGFR (estimated glomerular filtration rate) takes your creatinine, age, and sex and estimates your overall kidney filtration — reported as a number where higher is better. The glomeruli are the millions of tiny filtering units in your kidneys, and the "filtration rate" is roughly how many millilitres of blood they clean per minute (reported per 1.73 m² of body surface, a standard size adjustment). It's the headline kidney-function figure most clinicians use, and it's easier to interpret than raw creatinine because it already accounts for the fact that a "normal" creatinine for a 30-year-old differs from one for an 80-year-old.
The two move in opposite directions: higher creatinine → lower eGFR. Creatinine is the raw measurement; eGFR is the translated, standardized version of the same information.
Typical ranges
- Creatinine: ~0.7–1.3 mg/dL (men), ~0.6–1.1 mg/dL (women) — it scales with muscle mass, so muscular people naturally run higher, and people with less muscle run lower.
- eGFR: above 90 is typically normal; 60–89 is mildly reduced (often fine, especially with age); below 60 sustained for 3+ months can indicate chronic kidney disease.
Units and equations vary by lab and country — creatinine may be reported in mg/dL (US) or µmol/L (much of Europe), and the conversion is roughly ×88.4 from mg/dL to µmol/L. Always read your value against your own report's reference range.
The relationship between creatinine and eGFR, in more detail
It helps to think of creatinine and eGFR as two views of the same thing. Creatinine answers "how much waste is sitting in the blood right now?" eGFR answers "given this person's age and sex, what filtering rate does that waste level imply?"
Because eGFR is derived from creatinine, a small shift in creatinine can produce a larger-looking shift in eGFR — especially in the higher ranges, where the relationship is not linear. A change from 0.9 to 1.1 mg/dL might look minor, but it can move an eGFR from the 90s into the 70s. That's normal behaviour of the math, not necessarily a sign of new kidney damage, and it's one reason clinicians look at the pattern across several tests rather than reacting to a single-point drop.
One practical consequence: because both numbers come from the same blood creatinine, they can't disagree. If a lab reports a high creatinine with a "normal" eGFR, it's usually because eGFR is capped or reported as ">90" at the top end, not because the two are telling different stories.
The eGFR stages (G1–G5)
When eGFR is used to describe kidney function over time, it's grouped into stages. These are descriptive categories, not verdicts — many people sit in the earlier stages for years with stable, well-managed kidneys.
- G1 — eGFR 90+: normal filtration rate.
- G2 — eGFR 60–89: mildly reduced. On its own this is common and often unremarkable, particularly as people get older, since filtration tends to ease gradually with age.
- G3a — eGFR 45–59: mildly to moderately reduced.
- G3b — eGFR 30–44: moderately to severely reduced.
- G4 — eGFR 15–29: severely reduced.
- G5 — eGFR below 15: kidney failure.
Two important caveats keep these stages in perspective. First, a stage on its own is not a diagnosis: chronic kidney disease is defined by a reduced eGFR or signs of kidney damage that persist for at least three months — a single reading in the G2 or G3a range doesn't establish it. Second, the earlier stages (G1–G3a) are where the vast majority of people land, and the goal there is usually monitoring and managing contributors like blood pressure and blood sugar, not alarm.
Common causes of a genuinely reduced eGFR vs a transient creatinine bump
This is the distinction that matters most when you're reading your own result: a sustained reduction in filtering is different from a temporary nudge in creatinine.
Transient creatinine bumps (the number is up today, but filtering is fine):
- Dehydration — very common, and one of the most frequent reasons a single reading looks off.
- Intense exercise or a recent workout — hard training briefly raises creatinine.
- A high-protein meal or creatine supplements — both feed the creatinine pool directly.
- High muscle mass — a natural, benign reason a muscular person's creatinine sits higher, which can make their eGFR look lower than their kidneys actually are.
- Certain medications that affect the creatinine measurement or how it's handled by the kidney without changing true filtration (some antibiotics and other drugs). Never stop a prescribed medication over a lab value — ask the prescriber.
Causes of a genuinely reduced eGFR (filtering really is lower, and it tends to persist):
- Long-standing high blood pressure, which strains the small vessels feeding the filters.
- Diabetes or long-term high blood sugar, a leading driver of kidney stress worldwide. Seeing your kidney markers next to your fasting glucose is part of the picture here.
- Age-related decline, which is gradual and expected to a degree.
- Recurrent kidney issues, certain inherited conditions, or prolonged use of some medications, which a clinician assesses in context.
The everyday takeaway: one elevated creatinine is not automatically a kidney problem. A reduced eGFR that shows up repeatedly, over months, in someone with normal hydration and typical muscle mass is the pattern worth taking seriously.
Why eGFR estimates have limits
eGFR is powerful precisely because it's simple — one blood test, plus age and sex. But that simplicity is also its weakness, and it's worth understanding where the estimate can mislead.
Muscle mass is the big one. Because creatinine comes from muscle, eGFR quietly assumes an "average" amount of it. A heavily muscled athlete or someone on creatine can produce enough creatinine to look like reduced filtration when their kidneys are healthy. The opposite happens with low muscle mass — after major weight loss, in frailty, or with certain chronic illnesses — where a "reassuring" eGFR can overstate how well the kidneys are actually working.
Race coefficients have been removed. Older eGFR equations included a race-based adjustment. Major kidney and laboratory organizations have moved to race-free equations (the current CKD-EPI 2021 creatinine equation), because the older approach could distort estimates and delay care. If you're comparing an older result with a newer one, the switch in equation — not your kidneys — may account for part of any difference. This is another reason to trust the trend within a consistent method over cross-comparing values from different years or labs.
Cystatin C is an alternative. Cystatin C is a protein produced by nearly all cells at a steadier rate and is less influenced by muscle mass, so a cystatin C–based eGFR can be more accurate when creatinine is likely to mislead — in very muscular or very low-muscle people, for example. Some clinicians use it on its own or combine creatinine and cystatin C for a more robust estimate. You can read the marker background in our library under cystatin C.
The role of urine albumin (ACR) alongside eGFR
eGFR tells you how fast the kidneys filter. It doesn't tell you whether the filter has started to leak — and that's a separate, early signal worth knowing about.
The urine albumin-to-creatinine ratio (ACR) measures a small amount of the blood protein albumin appearing in urine. Healthy kidneys keep albumin in the bloodstream; when the filtering membranes are stressed, tiny amounts start slipping through. Because this can appear before eGFR drops meaningfully, ACR is one of the earliest ways kidney strain shows up — especially in people with diabetes or high blood pressure.
That's why kidney health is assessed with two axes, not one: your eGFR (filtration rate) and your ACR (whether it's leaking). A person can have a normal eGFR but a rising ACR, or a modestly reduced eGFR with a perfectly clean ACR — and those situations mean different things. If your bloodwork shows kidney markers being watched, a urine ACR is a common companion test.
Why the trend matters
Kidney function changes slowly, and single creatinine readings bounce around with hydration and activity. The trend across several tests is what reveals a real, gradual change versus a one-off blip from a gym session or a dry day. A drop from eGFR 95 to 78 in one reading can easily reverse on a rested, well-hydrated retest; a steady quarter-by-quarter slide is a different signal entirely.
Seeing eGFR plotted over time — alongside blood pressure, glucose, and hydration habits — is exactly the connected view scattered PDFs can't give. It also lets you keep the method consistent: same lab, same equation, so you're comparing like with like rather than chasing differences that come from a changed reference range. See how to read your blood test results and tracking lab results over time.
What typically happens next
If a creatinine or eGFR result falls outside the usual range, the follow-up is usually measured, not dramatic:
- A recheck. Because hydration, diet, exercise, and lab variation all move creatinine, a single off value is commonly repeated — often after a few weeks, well-hydrated and rested — before anything is concluded.
- A urine ACR test to check for the early leak signal that eGFR alone can miss.
- A look at the whole picture — blood pressure, blood sugar, medications, and other panels — since the kidneys rarely act in isolation. Markers like uric acid can be part of that broader metabolic view.
- Possibly a cystatin C–based eGFR if muscle mass makes the creatinine estimate unreliable.
- Ongoing monitoring rather than immediate intervention in the earlier stages, focused on the factors that protect kidney function over time.
None of this is a substitute for your clinician's judgement — it's simply what the pathway often looks like, so a follow-up request doesn't feel like a red flag by itself.
When to talk to a doctor
A low eGFR (especially below 60), a rising creatinine trend, or kidney markers flagged alongside high blood pressure or glucose should be reviewed by a clinician. The same goes for albumin showing up in your urine, or a result that doesn't fit your history. For more on understanding your panels, browse the rest of the Quanome blog.
Track your kidney markers over time, privately
Quanome pulls your lab results into one private timeline and tracks them over time — on your device, never uploaded. Learn more about Quanome →
Try the iOS beta →Frequently asked questions
What do creatinine and eGFR measure?
Creatinine is a waste product from normal muscle activity that your kidneys filter out, so blood creatinine reflects how well they're filtering. eGFR (estimated glomerular filtration rate) is a calculation based on creatinine, age, and sex that estimates your overall kidney function as a percentage-like number.
What is a normal creatinine and eGFR?
Creatinine commonly runs ~0.7–1.3 mg/dL for men and ~0.6–1.1 mg/dL for women (it scales with muscle mass). For eGFR, above 90 is typically normal, 60–89 mildly reduced, and below 60 sustained for 3+ months can indicate chronic kidney disease.
What does high creatinine mean?
Higher creatinine (and lower eGFR) suggests the kidneys are filtering less efficiently. But it can also rise temporarily from dehydration, intense exercise, a high-protein meal, high muscle mass, or certain supplements (like creatine), so context matters.
Can a single high creatinine be a false alarm?
Yes. Dehydration, a recent workout, or creatine supplements can transiently raise it. That's why a single value is often rechecked, and why the trend over time is more meaningful than one reading.
What is the relationship between creatinine and eGFR?
eGFR is calculated from your creatinine (plus age and sex), so the two move in opposite directions: as creatinine rises, eGFR falls. Creatinine is the raw filtered-waste measurement; eGFR converts it into an overall kidney-function estimate — which is why labs report them together.
What are the eGFR stages (G1–G5)?
Kidney function is grouped by eGFR into stages: G1 is 90+ (normal filtration), G2 is 60–89 (mildly reduced), G3a is 45–59 and G3b is 30–44 (mild-to-moderate and moderate-to-severe reduction), G4 is 15–29 (severely reduced), and G5 is below 15. These stages describe filtration rate; a diagnosis of chronic kidney disease also depends on how long it's been reduced and on urine tests.
Why isn't eGFR always accurate?
eGFR is an estimate built from creatinine, and creatinine depends heavily on muscle mass. Very muscular people, bodybuilders, or those on creatine can have a lower estimated eGFR without a kidney problem, while people with low muscle mass can have a falsely reassuring one. In those situations a cystatin C–based eGFR, which is less tied to muscle, is sometimes used instead.
What is urine albumin (ACR) and why does it matter?
The urine albumin-to-creatinine ratio (ACR) checks whether small amounts of protein are leaking into your urine — an early sign of kidney stress that eGFR alone can miss. Kidney health is assessed using both together: your eGFR (how fast you filter) and your ACR (whether the filter is leaking).
Does a low eGFR mean I have kidney disease?
Not on its own. A single low eGFR can reflect dehydration, a recent illness, or a lab quirk. Chronic kidney disease is defined by a reduced eGFR (or signs of kidney damage like albumin in the urine) that persists for at least three months, which is why doctors recheck before concluding anything.
The Quanome iOS beta is live
Make sense of your DNA and health data privately — try Quanome free on TestFlight now (Android coming later).
Try the iOS beta →Free TestFlight beta for iPhone. Not on iOS? Leave your email and we'll keep you posted (and ping you when Android lands).